- Solutions
- Resources
- About
- Advertising
- Trust and Brand Safety
A Buyer’s Guide to Choosing an Anti-Fraud Solution

In our previous article, we had discussed various strategies deployed by anti-fraud solutions to counter fraud today. The most prevalent technique being static threshold detection (i.e., defining known frauds, and then focusing on detecting those anomalies with predetermined fixed thresholds).
However, this is both ineffective and inefficient against constantly evolving, newer fraud methods for a simple reason — how do you find something when you don’t know what to look for?
No system can be 100 percent foolproof. There will inevitably be fraudulent installs/events that solutions fail to catch (false negatives) — or worse, flag clean installs/events incorrectly (false positives). This is critical, since such inaccuracies have adverse impact on advertising ROI, as we will see later.
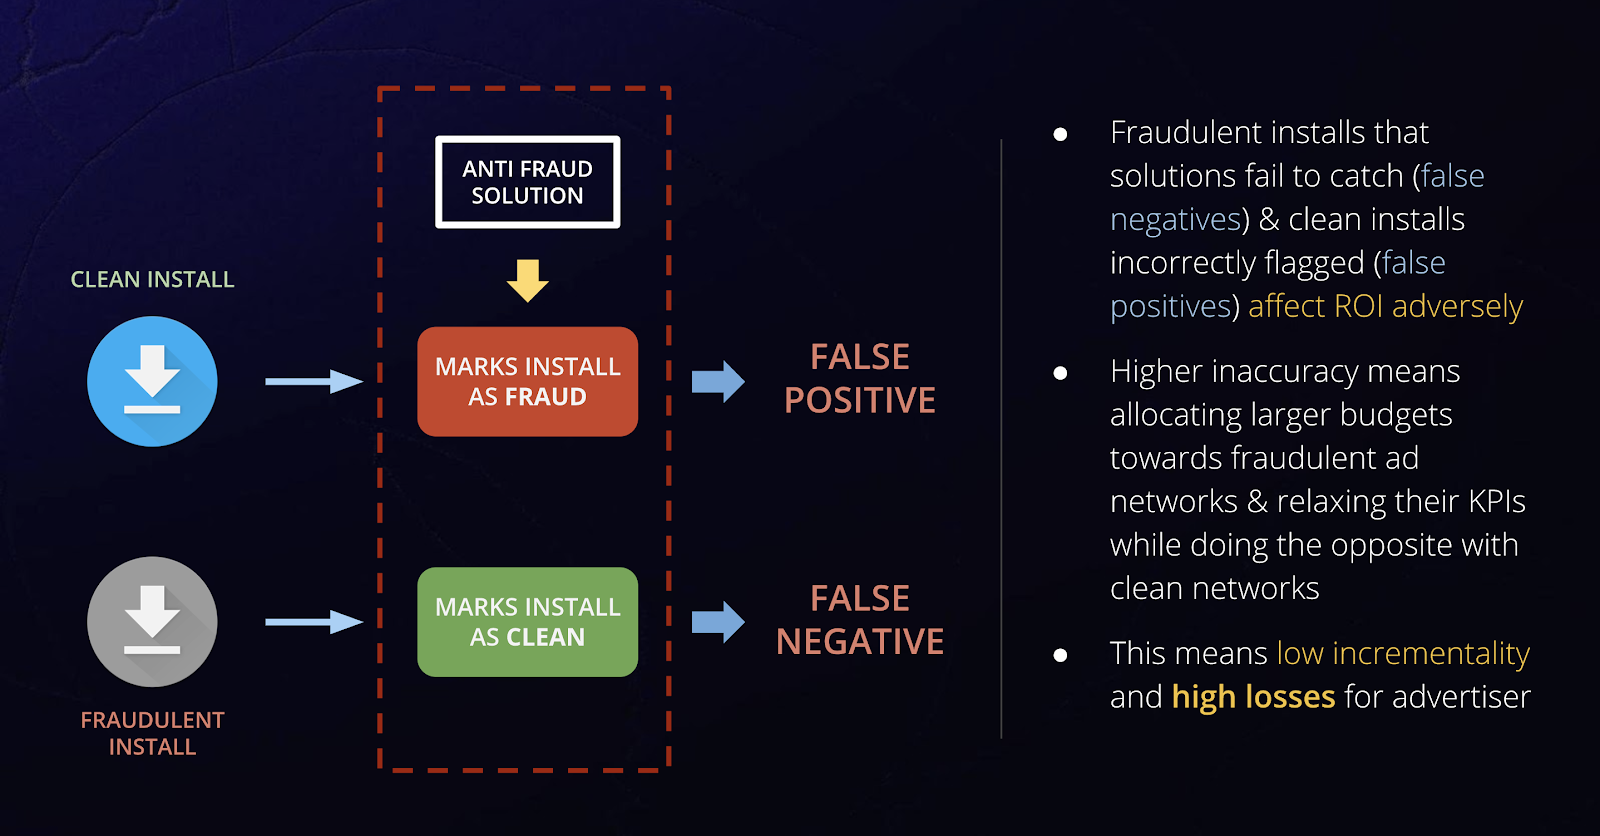
This brings us to the next point: how does one evaluate the countless anti-ad fraud solutions available in the market?
We have made that daunting process easier for you with this systematic checklist to evaluate anti-fraud products.
1. Accuracy and Reliability
Say a mobile campaign delivered 100 installs, of which 20 installs are fraudulent. The (accuracy) problem with most anti-fraud solutions is which 20 they flag as fraud.
One way to evaluate this is to compute the false positive and false negative metrics.
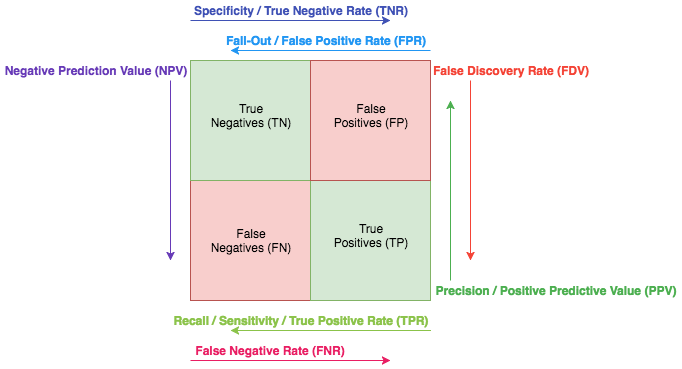
The confusion matrix (Image source: sanyamkapoor.com)
It is important to note that both false positives and false negatives reward bad players in the long run and hurt clean players severely.
More importantly, false positives and false negatives hurt advertisers even more as they fall prey to cognitive biases such as hyperbolic discounting — i.e., the tendency to overvalue a present reward and undervalue a future reward, even if it is larger. This is illustrated in the example below.
Say InMobi drove 100 installs at $2 CPI and a fraudulent network drove 1,000 installs at $1 CPI. An anti fraud solution marks 2% of the installs from InMobi and 20% of the installs fraudulent network as fraud.
In the short term, the fraudulent ad network will “appear” to look like the better partner purely based on campaign performance that return high numbers of installs. But in reality, these ad networks hurt the advertiser because 80–85% of the fraud lies upstream which cannot be detected in downstream metrics such as MTTI that most anti-fraud solutions rely upon. This means it’s very likely that 90% of the installs (900 installs) driven by the fraudulent network were misattributed. That results in an effective CPI of $10 as against $2 CPI driven by InMobi for the same scale (100 installs).
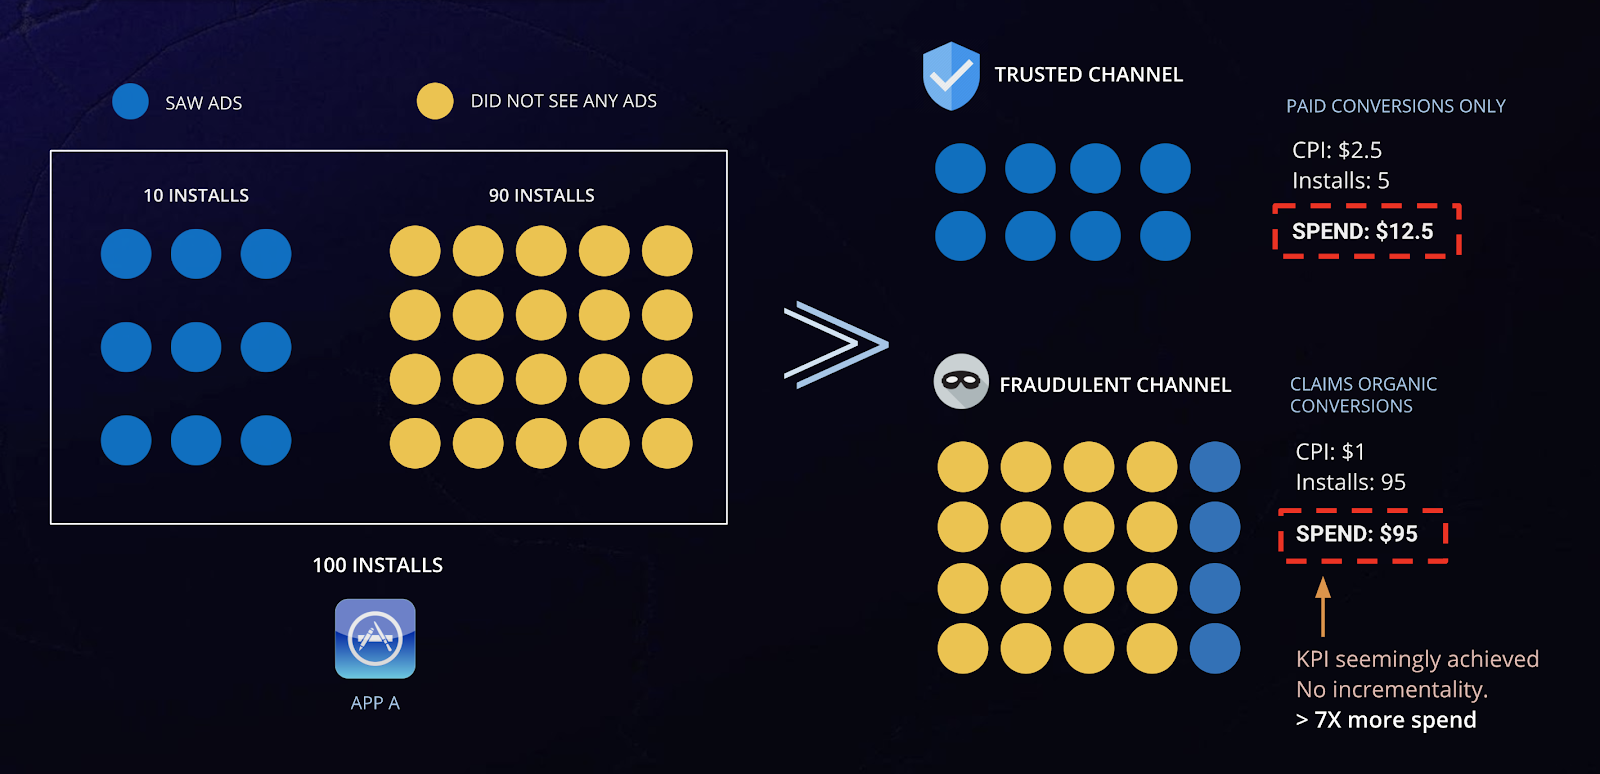
Sample Illustration: Seemingly high ROI campaigns does not mean fraud-free or efficient spending. True ROI is reflected in incrementality.
Thus, determining the false positive rate and false negative rate of an anti-fraud solution is critical.
However, computing these numbers is not so straightforward. This is because suspected fraud installs (as opposed to confirmed fraud installs) cannot be definitively classified as fraudulent in a short period, which affects computation of the false positives.
What to Ask: It’s important to check if anti-fraud systems have done detailed studies that publish their false positive and false negative numbers. Be sure to place an importance on these stats when evaluating various products.
2. Transparency
How frameworks deal with noise (especially false positives) is a key indicator of reliability of the service.
As seen earlier, incorrectly set thresholds and criteria can lead to genuine events being identified as outliers and flagged as fraudulent. This results in exceedingly high number of false positives.
The good news is that there are many techniques that can help determine the accuracy of the anti-fraud solutions. Two often used methods include:
- Setting up honeypots.
- Cohort analysis of fraud installs (i.e., evaluating installs marked as fraudulent with similar clean paid cohorts for behavioral differences).
It is important to note that these methodologies involve significant cost and time (usually upwards of two months), which again indicates the seriousness of the player in tackling fraud.
If the player is investing in such techniques, then they would also be reversing decisions constantly to reduce their false positive and false negative errors. They should also be able to defend their decisions (on fraudulent installs) when ad networks ask for conclusive data on why installs are marked fraudulent.
What to Ask: Evaluating a fraud solution’s framework is a continuous process, and anti-fraud solution providers need to be willing to invest resources to check the accuracy of their flagging mechanisms constantly for each and every advertiser and campaign. Be sure to check with other ad networks and advertisers how many times the anti-fraud product has been able to successfully defend their decisions — this is a marker of their reliability.
3. Pricing
The pricing model is probably the best indirect indicator of effectiveness (and intentions) of the anti-fraud product and the company.
Billing on the basis of number of installs flagged as fraudulent is incentivized towards ‘marking’ fraud and not ‘detecting’ fraud. It’s easy to see why — the more installs marked as fraud, the higher the payout.
As often noted in the points above, the objective is to minimize errors and accurately flag fraudulent installs. However, billing structures, such as the one described above, set the wrong incentives in marking a higher percent of installs as fraudulent without sufficient evidence or reason.
A click-based model to pricing is best suited — that is pricing on clicks analyzed and not number of installs flagged.
What to Ask: What is the reasoning behind the pricing model of the solution?
4. Evaluation Criteria
As discussed in our previous blog, fighting fraud is not easy as it requires the following:
- Investment (of resources and time).
- Experience (in dealing with ad fraud).
- Data (large data points from across markets).
When choosing the product, evaluate them on each of the above criteria.
Access to data across regions, experience, availability of resources (how many other customers does your anti-fraud account manager oversee?) and diversity of clients is critical in building a strong framework and adds to their credibility.
5. Use of Machine Learning
Machine learning is a huge buzzword at the moment. So much so that it is used as a “catch-all” term to either flag installs as fraudulent when sufficient evidence isn’t available. The term is also frequently used to defend inadequate methodologies such as ones with static and manually set thresholds.
Make no mistake that machine learning is critical to designing a system whose outputs are based on probabilities and that is adaptive to changing evidence. However, many products use machine learning as nothing more than a buzzword without actually having a working model in place. Fortunately, it’s possible to call out those who engage in such tactics.
What to Ask: Evaluate the list of reasons provided by the solution and carefully scrutinize those which are vague. For example, fraud reasons such as “too many engagements” and “distribution outliers” do not say much and are very likely to be false positives. Question the salesperson and their engineering teams on the algorithms and models used. If they can’t explain what their machine learning algorithms and models do in simple to understand terms, then it’s very likely that they are simply using machine learning as a guise.
6. Evaluating the Detection Methodology
It is important to understand that the most widely used integrations with anti-fraud products is server-to-server. It basically means that all fraud checks that happen are based on the post-click data that is shared by the ad network or DSP with the anti-fraud product (it is the same with trackers as well).
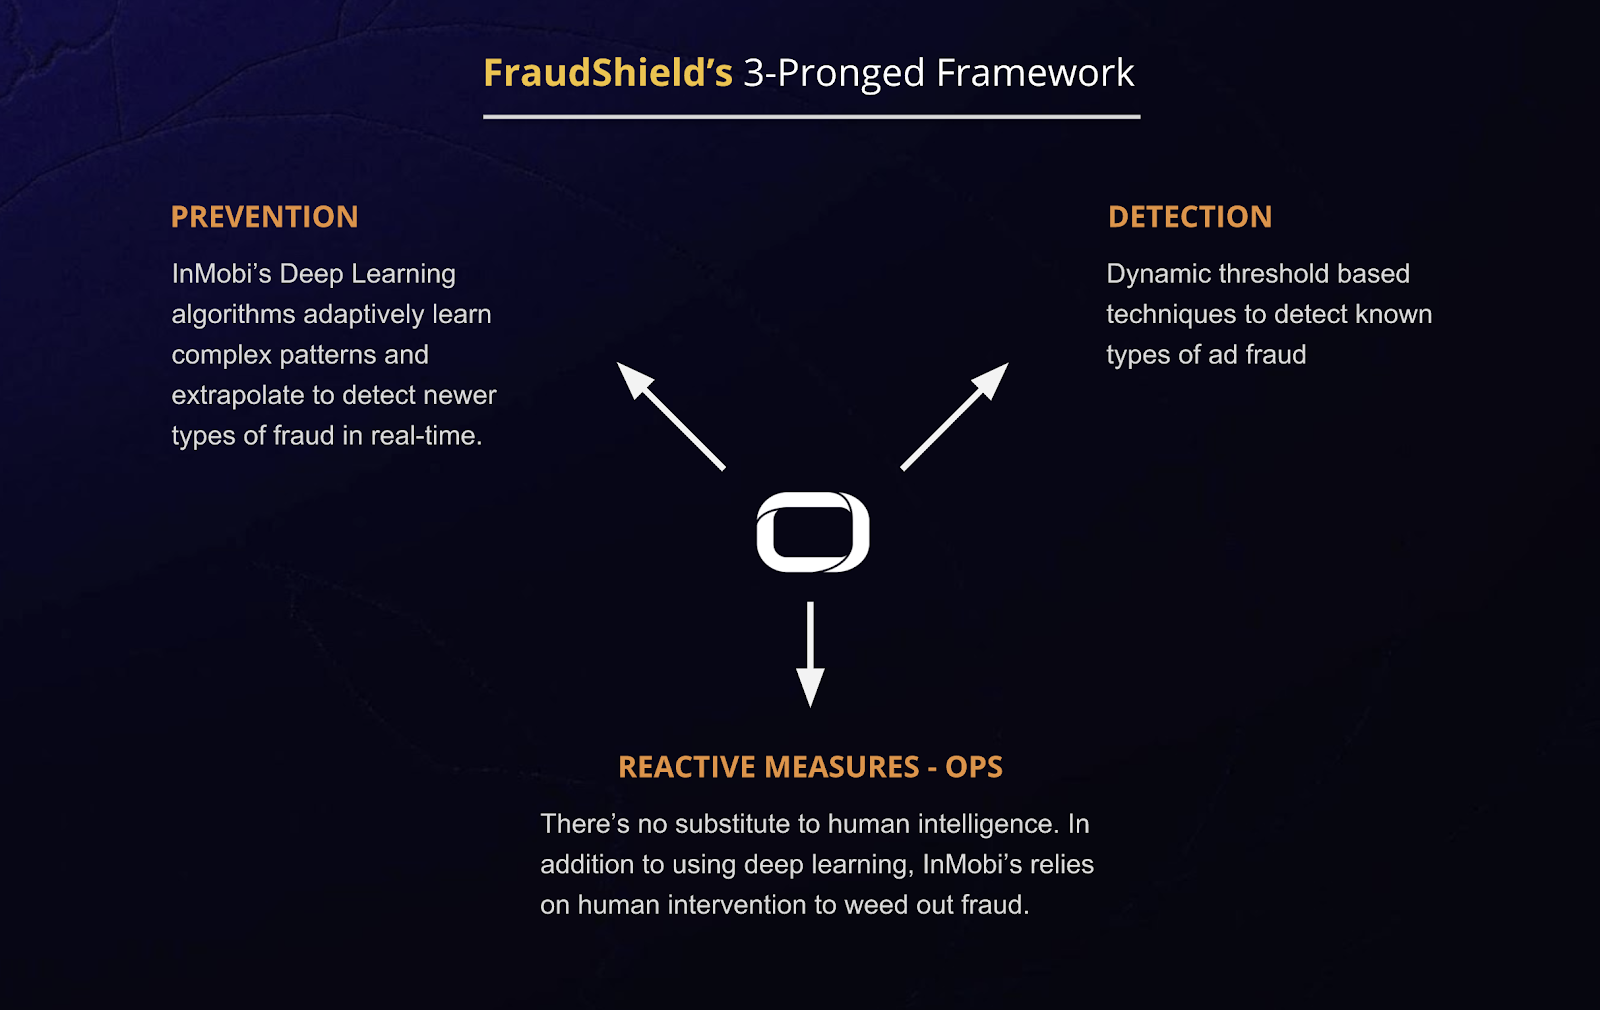
This means that most anti-fraud frameworks inordinately focus on the last mile (post-click data) for fraud detection. But, as we had covered previously, fraud is not a last-mile problem. Fraud starts upstream.
- Today’s solutions start their analysis and classifications post-click. But, that is just one piece of the puzzle while tackling fraud.
- Fraud requires checks at every touch point → right from the time of a publisher getting onboarded until the time an install event happens (and beyond), every step needs to be scrutinized for fraudulent activity.
Reactive Fraud Metrics such as MTTI work well only for downstream checks.
- While metrics such as MTTI (aka CTIT) help detect fraud downstream — i.e., detecting installs as fraud after they have come in (reactive), there’s a lot more fraud that goes on upstream that go undetected.
- The MTTI metric along with MTTI distribution plots alone cannot detect or prevent those upstream frauds. This again leads to high number of false negatives and false positives.
- The major problem that false positives create is that they can easily drown out legitimate installs from clean ad networks.
- How anti-fraud frameworks minimize such false positives without blinding the advertiser to fraudulent installs is the ultimate goal.
Does the framework go beyond MTTI metrics?
- If a network is driving an install every 300 clicks per user, then metrics such as MTTI are irrelevant. The installs are, without a doubt, suspicious.
- The directional indicators of such fraud all lie in upstream metrics.
Adoption of Leading Metrics
If the anti-fraud framework uses reactive fraud metrics as the sole source of truth, it ends up with a lot more errors (false positives and false negatives), and penalize the good ad networks who do more stringent checks upstream. Check with the makers of the anti-fraud product if and how they use the leading metrics such as Mean Clicks to Install (MCTI) in fraud detection.
7. Look for Conflict of Interest
For instance, a tracker offering their anti-fraud product as a separate, paid point solution. The business model is set up in such a way as to make up for any lost revenues from the attribution services business line (since fraud means fewer installs billed) with anti-fraud services that make up for those revenues. If these players were serious about fighting ad fraud then they should either bundle the anti-fraud service and provide it as a unified solution or provide it for free.
Stay Up to Date
Register to our blog updates newsletter to receive the latest content in your inbox.


