- Solutions
- Resources
- About
- Consumer Research
Are Your Video Views Accurate? Comparing Video Viewability Metrics

Learn How InMobi Stacks Up to the Industry When It Comes to Video Viewability for Mobile App Advertising
Mobile video advertising, especially in-app, has a proven track record. It yields click-through rates that are 56% better than banners and 34% better than native ads. No wonder advertisers are spending more on these ad formats year over year.
But, how can you make sure people are actually watching and interacting with your in-app ads?
In particular, ad fraud related to invalid traffic (i.e. non-human traffic, like from bots) is on the rise. Brands lost approximately $6.5 billion from this kind of fraud in 2017 alone.
In light of this, how can advertisers be sure their video ads are viewable and actually seen by their target audience? The answer lies in using the right partners - ones that are committed to fighting fraud and ensuring quality ad views.
This is an area we’ve long been passionate about, and the video ad viewability rates prove it. Compared to the industry standards and benchmark figures from trusted third parties like Moat and IAS, we’re well ahead of the curve.
InMobi's Average Video Advertising Viewability Rates
Moat Q2 Benchmark: 56% // InMobi U.S. Video: 93%
IAS Q2 Benchmark: 50% // InMobi U.S. Video: 92%
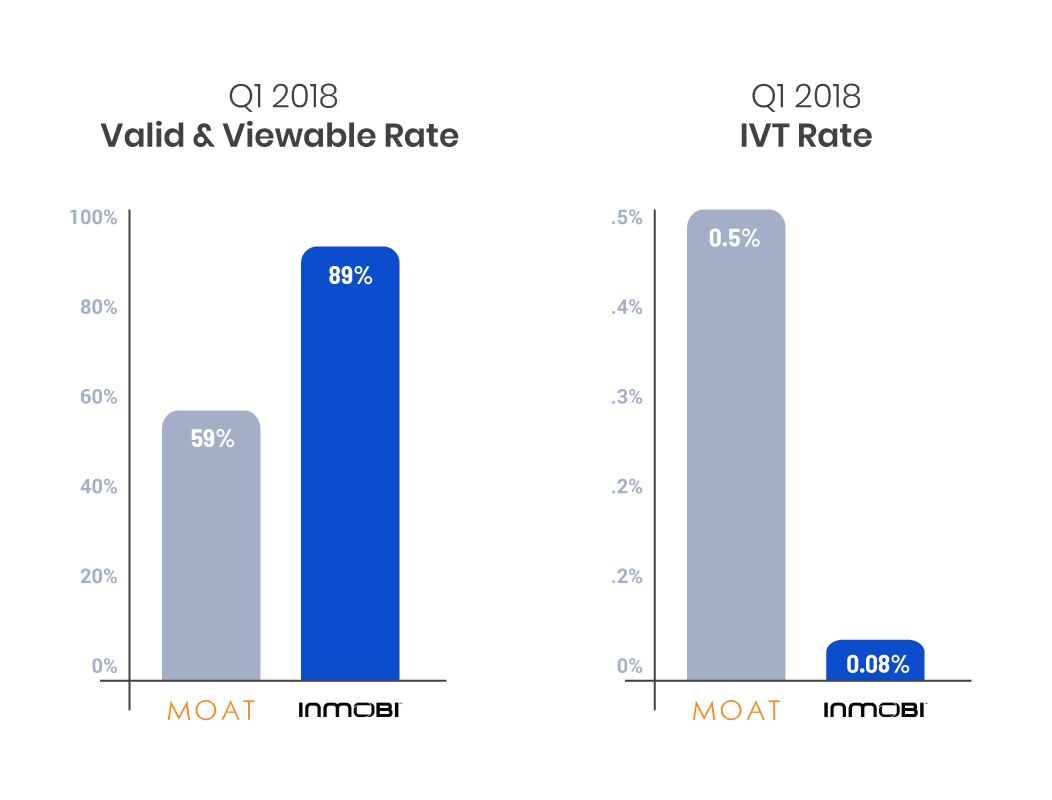
InMobi vs. Moat in 2018:
Q2 2018 Valid and Viewable Rate
- Moat: 59.9%
- InMobi: 83.37%
Q2 2018 IVT Rate
- Moat: 0.5%
- InMobi: 0.09%


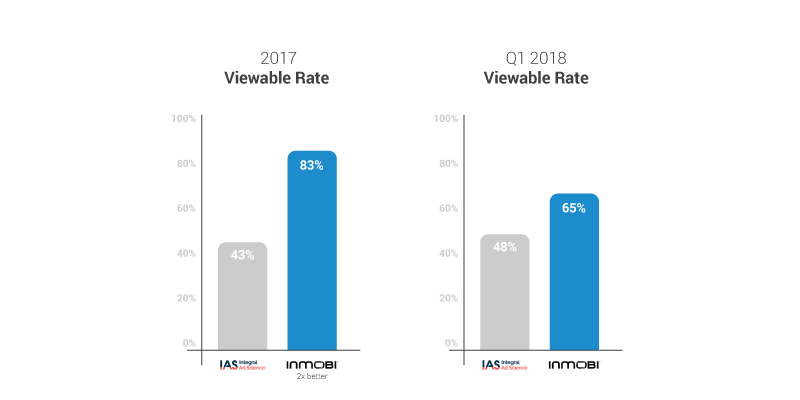
InMobi vs. IAS:
Q2 Viewable Rate
- IAS: 49%
- InMobi: 72%

Benefits of Mobile In-App Video Advertising
And, in the U.S. in the second quarter of 2018, InMobi's valid and viewable rate was, according to Moat, 72.5% for display ads and 89% for video.
According to IAS, our viewable rate for was 67% for display and 93 percent for video in the U.S. during the same time frame. In Q2 2018, InMobi's total viewable rate globally was 72%.
In today’s era of ad fraud and rising brand safety concerns, we know trust is earned and built. That’s why we’re committed to earning it through radical transparency, industry-leading quality and verifiable metrics and measurements. To learn more about our efforts and how they help advertisers see huge ROI from their mobile video investments, check out inmobi.com/trust.
Not only is InMobi in-app video advertising viewable, but it also drives results. According to our 2019 Mobile Programmatic Advertising Trends report, click-through rates (CTRs) for video ads were over 2x greater than native CTRs and over 10x greater than CTRs for banners on average during the first three months of the year. In fact, in that quarter, the average CTR for video ads was over 3%. In comparison, during the first three months of 2018, the Interactive Advertising Bureau (IAB) found that video ad CTRs were only around 0.26% in the U.S. on average.
Defining Viewable Impressions for Mobile Video Advertising
When we're looking at average viewability, what are we really talking about? Many brands have their own definition, which can create problems.
The classic definition comes from the Media Ratings Council, which says that 50% of an ad must be in active view for a minimum of one second. But, when looking at viewability metrics, it's important to note that not everyone follows this.
When looking at viewability, make sure you have a set definition and that you're comparing apples to apples when looking at how your campaigns compare to others.
Learn More About In-App Video Advertising and Video Viewability
- Calculating Mobile Video Advertising Growth and Other In-App Video Ad Stats You Need to Know [Infographic]
- Guaranteeing Viewability, Reducing Fraud with DoubleVerify and InMobi
- Mobile In-App Advertising and Trust: What You Need to Know
Dmexco 2018 - Leading Viewability with InMobi from Mobile Marketing Magazine on Vimeo.
About the Author
Matthew Kaplan has over a decade of digital marketing experience, working to support the content marketing and search optimization goals of the world’s biggest B2B and B2C brands. He is a passionate app user and evangelist, working to support diverse marketing campaigns across devices.
Stay Up to Date
Register to our blog updates newsletter to receive the latest content in your inbox.


